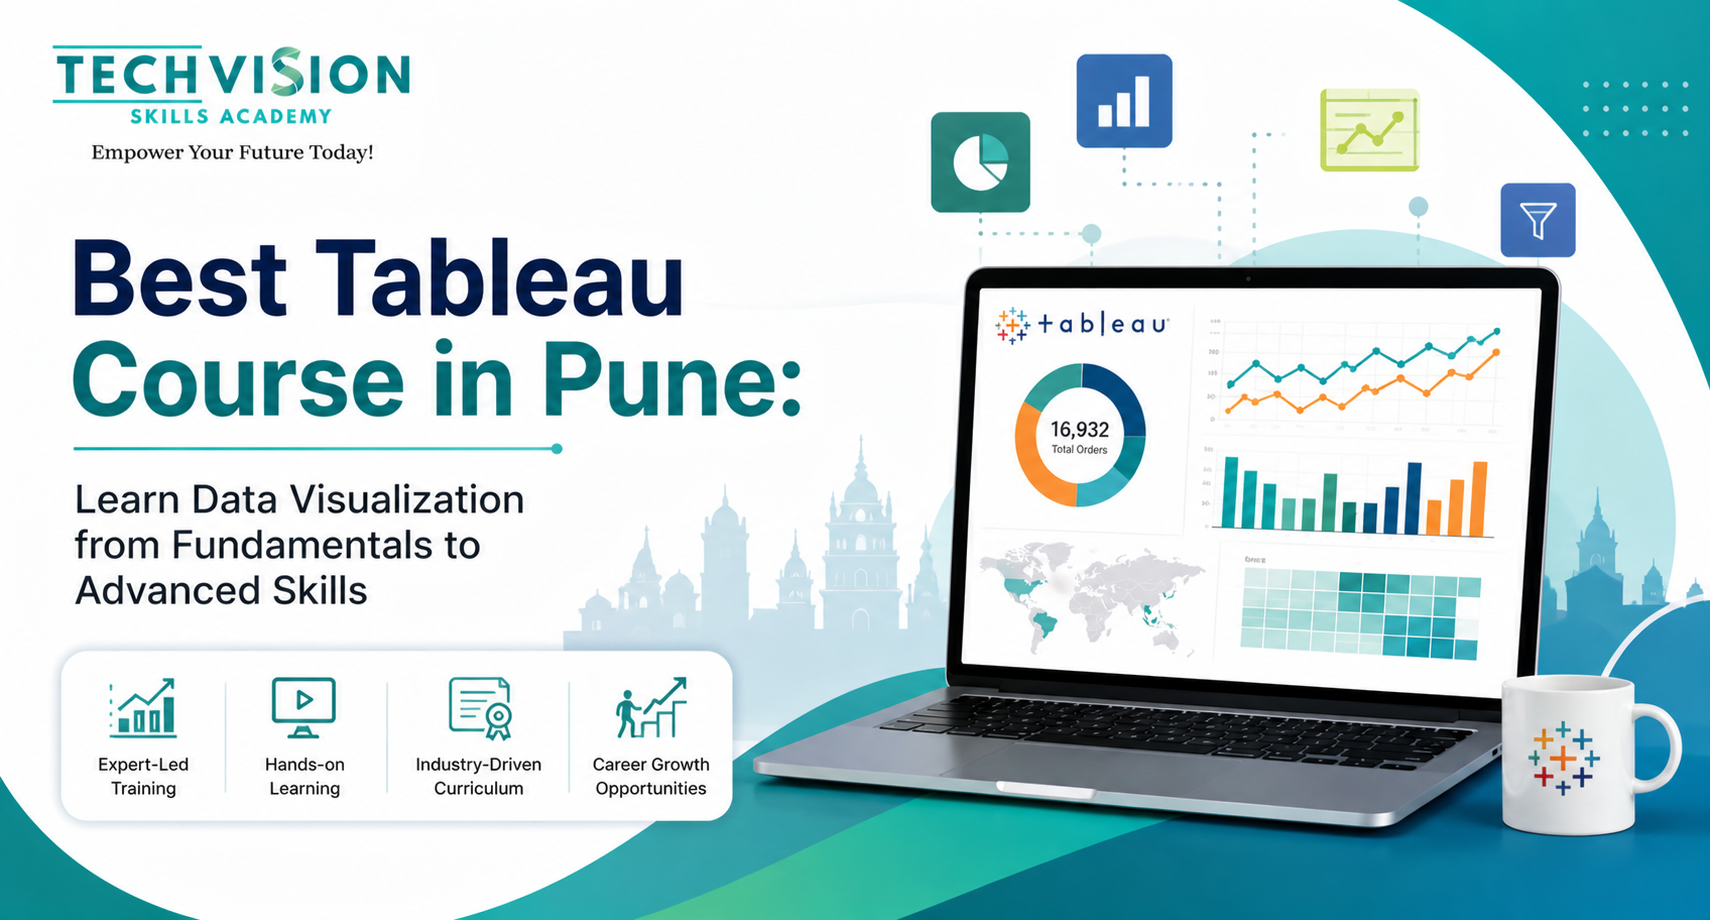
Best Tableau Course in Pune: Learn Data Visualization from Fundamentals to Advanced Skills
TechVision
October 23, 2026
Tableau training
In today’s data-driven business environment, organizations need professionals who can transform complex information into clear, meaningful insights. Data visualization helps businesses understand performance, identify trends, and make informed decisions. If you want to build practical analytics skills, enrolling in the Best Tableau Course in Pune can be a valuable step toward developing your knowledge of business intelligence and data visualization.Tableau is a popular data visualization platform that enables users to analyze data, create interactive dashboards, and communicate business insights through visual reports. Whether you are a student, working professional, business analyst, or someone planning to enter the data analytics field, learning Tableau can help you develop skills that are useful across multiple industries.With structured learning, hands-on exercises, and real-world projects, learners can progress from basic charts to advanced dashboards and analytical techniques.
What Is Tableau and Why Is It Important?
Tableau is a business intelligence and data visualization platform used to explore data and present findings through interactive visualizations. Instead of relying entirely on spreadsheets and lengthy reports, professionals can use Tableau to create charts, graphs, maps, and dashboards that make business information easier to understand.Tableau supports connections to different data sources, helping users analyze information and build visual reports. Its dashboard features allow multiple visualizations to be combined into a single interactive view.Businesses use data visualization for sales analysis, financial reporting, customer behavior analysis, marketing performance measurement, and operational planning.Learning Tableau can help you understand how to convert raw data into useful business insights. These skills are particularly valuable for professionals who want to work in analytics, reporting, business intelligence, and data-driven decision-making.
Why Choose the Best Tableau Course in Pune?
Pune has a growing technology, education, manufacturing, and business services ecosystem. Students and professionals looking to strengthen their technical skills can explore training opportunities in business intelligence and analytics.Choosing theBest Tableau Course in Pune should involve more than comparing course fees. Look for a program that balances theoretical knowledge with practical exercises and project experience.
1. Learn from Fundamentals to Advanced Skills
A well-structured Tableau course should start with the basics and gradually introduce more advanced concepts. Beginners can learn how to navigate the interface, connect data sources, and create basic charts before progressing to calculations, filters, and interactive dashboards.This step-by-step approach helps learners build a strong foundation without feeling overwhelmed by advanced features.
2. Gain Practical Dashboard Development Experience
Practical learning is essential for understanding how Tableau works in real business situations. Learners should practice building dashboards using sales, marketing, finance, customer, and other relevant datasets.Working on projects allows you to apply your knowledge, solve analytical problems, and demonstrate your abilities to potential employers.
3. Develop Industry-Relevant Skills
Tableau skills can support a variety of professional activities, including reporting, trend analysis, performance monitoring, and business analysis.A good training program should explain how visualization techniques can be applied to real business challenges rather than focusing only on software features.
4. Prepare for Career Opportunities
Tableau training can help you build the technical foundation needed for entry-level analytics and reporting roles. To improve your career readiness, combine Tableau with complementary skills such as Excel, SQL, data interpretation, and business communication.
What Will You Learn in Tableau Training in Pune?
A comprehensive tableau training in pune program should cover beginner, intermediate, and advanced topics. The exact syllabus depends on the training provider, so review the course curriculum before enrolling.
Module 1: Introduction to Tableau
Start by understanding the Tableau interface and the fundamentals of data visualization.Topics may include:
Introduction to business intelligence and data analytics
Understanding the Tableau workspace
Connecting Excel and CSV files
Exploring dimensions and measures
Understanding worksheets and workbooks
Creating your first visualization
This module helps beginners understand the software and learn how to explore data effectively.
Module 2: Basic Data Visualization
After learning the interface, you can explore different ways to present data visually.Topics may include:
Bar charts and line charts
Pie charts and scatter plots
Tables and highlight tables
Maps and geographic visualizations
Sorting and grouping data
Applying filters
Formatting charts and labels
Understanding when to use each chart type is important. For example, line charts can help display changes over time, while bar charts are useful for comparing categories.
Module 3: Data Preparation and Organization
Data preparation is an important part of analytics because inconsistent or incomplete information can affect reporting accuracy.Depending on the course, you may learn to:
Connect multiple data sources
Join and relate datasets
Organize fields and data types
Handle common data-quality issues
Use groups and hierarchies
Work with dates and geographic fields
These concepts help you prepare datasets for more reliable analysis.
Module 4: Calculations and Analytical Techniques
Intermediate Tableau training introduces techniques for creating more flexible visualizations and performing deeper analysis.Important topics may include:
Calculated fields
Aggregate calculations
Table calculations
Parameters
Level of Detail expressions
Date calculations
Conditional logic
These features help users analyze information according to specific business requirements.
Module 5: Interactive Dashboard Development
Dashboards bring multiple visualizations together so users can understand important metrics in one place.During dashboard training, you may learn how to:
Combine worksheets into dashboards
Add interactive filters
Configure dashboard actions
Design effective layouts
Highlight key performance indicators
Improve readability and usability
Present findings through data stories
For example, a sales dashboard could display total revenue, monthly sales trends, regional performance, and top-performing products. Users could interact with filters to examine specific periods or regions.
Module 6: Advanced Tableau Skills
Advanced training can help you move beyond basic reporting and build more sophisticated analytical solutions.Topics may include:
Advanced calculations and LOD expressions
Complex chart development
Geographic analysis
Dashboard optimization
Data blending and relationships
Publishing and sharing dashboards
Tableau Cloud or Tableau Server fundamentals
The advanced syllabus should match your career goals and the type of work you want to perform.
Benefits of Learning Tableau
Better Data Analysis Skills
Tableau helps you explore large datasets visually and identify patterns that may not be obvious in traditional reports. These capabilities can improve your ability to interpret business performance and communicate findings.
Improved Reporting Efficiency
Interactive dashboards can bring important metrics together in one place. This can reduce dependence on manually prepared reports, although the amount of time saved depends on the data sources and reporting workflow.
Stronger Business Decision-Making
Visual reports can help teams compare results, monitor performance, and investigate changes. When dashboards are built using reliable data, they can support better-informed business decisions.
A Portfolio of Practical Projects
Projects are an important part of learning. A portfolio containing well-designed dashboards can demonstrate your practical skills during interviews.Consider creating projects such as a sales performance dashboard, customer analysis dashboard, financial reporting dashboard, or marketing campaign performance dashboard.
Flexible Learning for Different Backgrounds
Tableau can be useful for learners from commerce, management, IT, engineering, finance, and marketing backgrounds. Beginners do not necessarily need programming experience to get started, although SQL and spreadsheet skills can be helpful as you advance.
Career Opportunities After Tableau Training in Pune
Completing Tableau training can support your preparation for several data-related career paths. However, employment depends on your overall skills, experience, portfolio, and the requirements of individual employers.Potential roles include:
1. Data Analyst
Data analysts examine datasets, identify trends, prepare reports, and communicate findings. Tableau can help them build dashboards and present analytical results.
2. Business Intelligence Analyst
Business intelligence analysts use data to support business planning and performance monitoring. Tableau is one tool they may use to create dashboards and reporting solutions.
3. Tableau Developer
Tableau developers build, maintain, and improve visualizations and dashboards. This role may require stronger knowledge of calculations, data modeling, SQL, dashboard performance, and publishing environments.
4. Reporting Analyst
Reporting analysts prepare regular business reports, monitor key performance indicators, and help departments understand their results. Tableau can support interactive reporting and data presentation.
5. Business Analyst
Business analysts work with stakeholders to understand business requirements and support improvements through analysis. Tableau can help them communicate trends and performance measures.
6. Marketing Analyst
Marketing analysts examine campaign performance, customer behavior, website metrics, and lead generation results. Tableau can help visualize marketing data and compare performance across campaigns and channels.For better career prospects, consider combining Tableau with Excel, SQL, business knowledge, and practical project experience.
Who Should Enroll in Tableau Training?
Tableau training can be useful for:
Students planning to enter data analytics
Fresh graduates looking to develop practical technical skills
Working professionals seeking to improve reporting capabilities
Business analysts who want to create interactive dashboards
Finance and operations professionals working with performance data
Marketing professionals interested in campaign analytics
Professionals preparing for business intelligence roles
Even if you are new to analytics, you can begin with basic visualization concepts and progress at your own pace.
How to Choose the Right Tableau Course in Pune
Before selecting a training institute, compare the curriculum, practical sessions, learning support, and project opportunities.Consider the following factors:Updated syllabus: Check whether the program covers basic visualization, calculations, dashboard development, and relevant advanced features.Hands-on practice: Look for opportunities to work with datasets and develop complete dashboards.Trainer experience: Ask about the instructor’s practical experience with Tableau and business intelligence projects.Project portfolio: Confirm whether you will complete projects that you can explain during interviews.Learning support: Check whether doubt-clearing sessions, practice materials, and assignment feedback are available.Career assistance: If placement support is advertised, verify what it includes. Training and certification do not guarantee employment.Flexible learning options: Compare classroom and online formats based on your schedule, budget, and preferred learning style.Choosing a course that matches your current level and career goals can make your learning experience more productive.
Frequently Asked Questions
Is Tableau suitable for beginners?
Yes. Beginners can start with the Tableau interface, data connections, and basic charts before moving to advanced calculations and dashboards.
How long does it take to learn Tableau?
The time required depends on your learning schedule and previous experience. You may learn basic features relatively quickly, but developing confidence with advanced analytics generally requires consistent practice and project work.
Do I need coding skills to learn Tableau?
No, you can begin without programming knowledge. However, SQL, Excel, and basic analytical concepts can help you work with more complex datasets and prepare for analytics roles.
Does Tableau training guarantee a job?
No course can guarantee employment. Practical skills, projects, communication, relevant experience, and interview preparation all influence job opportunities.
Can marketing professionals benefit from Tableau?
Yes. Marketing professionals can use Tableau to visualize campaign results, leads, conversions, customer segments, and other performance indicators.